Quantifying the Probability of Flaws in Open Source

Jay Jacobs and I recently delivered an RSA presentation called Quantifying the Probability of Flaws in Open Source. Since many people didn’t get a chance to see it, I thought I’d summarize some of the findings here for posterity.
The question we investigated was simple, at least conceptually: what are the red flags of an open-source repository? Are there characteristics of a given open source library that would reliably indicate it was safer than others? Knowing that 79% of the time, developers never update third-party libraries once introducing them to a codebase, a data-driven methodology for selecting trustworthy libraries could certainly have value.
Looking at OWASP’s Top 10 OSS Risks as a starting point, you can quickly observe that many of the risk factors – unmaintained software, outdated software, untracked dependencies, under/over-sized dependencies – are really only problems if there’s an actual vulnerability. Therefore, by focusing our lens on known vulnerabilities, we actually end up addressing the majority of the risks that don’t involve an attacker actively targeting a project. As we know, all bets are off when that happens.
We leveraged a few data sets for this research. We had 11.4 million SCA scans and 12.2 million SCA findings which were also used in producing Veracode’s SoSS 2024 report. We also pulled metadata directly from public GitHub repositories. Finally, we used scorecards from the OpenSSF’s weekly scan of the 1 million most critical open-source projects.
Why OpenSSF?
The idea of the OpenSSF scorecard is to understand the security posture of an open source project so that you can assess the risks introduced by the dependencies you consume. There are various tools available for calculating the OpenSSF score, and it’s easy to incorporate into a GitHub project if you’re the project owner.
The scorecard measures a number of machine-checkable factors on a scale of 1 to 10, each of these is weighted (low, medium, high, or critical), and then all of those weighted risk factors are combined to result in an overall numeric score between 0 and 10. For example, they can look at commit frequency to determine if the project is actively maintained. Or they can consult the OSV to determine if the project has unfixed vulnerabilities.
By cross-referencing OpenSSF data – both the overall scores and the individual risk factors – against libraries that we see appear in real-world applications, we can start to search for meaningful correlations.
Real-world library coverage
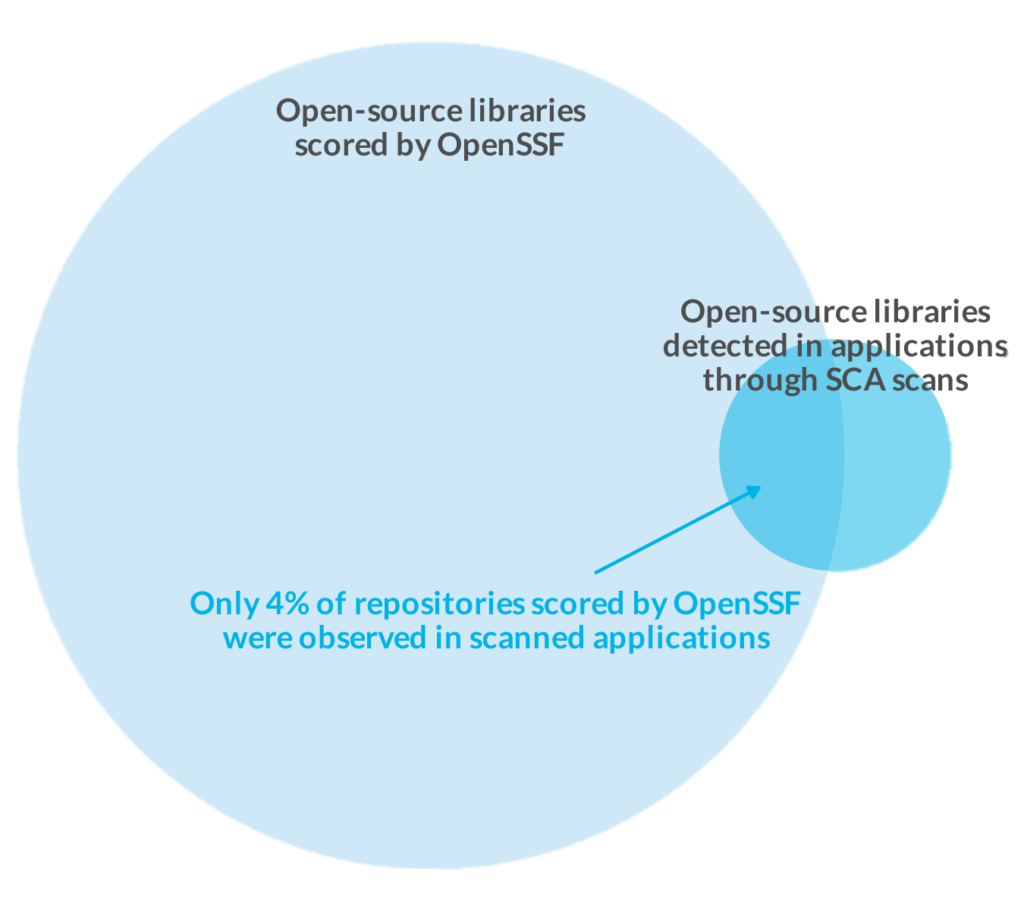
An OpenSSF score can be a good starting point for reducing risk in library selection – if you can find a score, that is. Over 1.2 million open-source libraries have been scored by OpenSSF; however, when we look at the libraries that are actually being used in (mostly) Enterprise-grade applications, only about half of them actually had an OpenSSF score. In fact, 96% of the libraries scored by OpenSSF are never seen in real-world applications! The area where the circles overlap below comprises only about 48 thousand libraries.
Name matching failures might be exacerbating the situation, but it’s difficult to gauge the extent without some manual analysis. Another limitation is that the OpenSSF list is currently derived from GitHub-hosted projects only.
In SoSS 2024 you can also find the following analysis, which I won’t rehash here:
- Comparison of OpenSSF scores for libraries observed in real-world apps compared to libraries that are never seen in the wild
- OpenSSF scores mapped against various commit activity measurements from GitHub metadata
- OpenSSF scores mapped against upstream applications’ accrual of security debt
- The existence of any OpenSSF score mapped against upstream applications’ vulnerability remediation speed
Down the OpenSSF rabbit hole
In order to meet our objectives, we delved deeper into OpenSSF to understand how best to leverage the information it provides. In doing so, we observed some curious things.
Below is the distribution of scores for each check that contributes to the OpenSSF calculation.
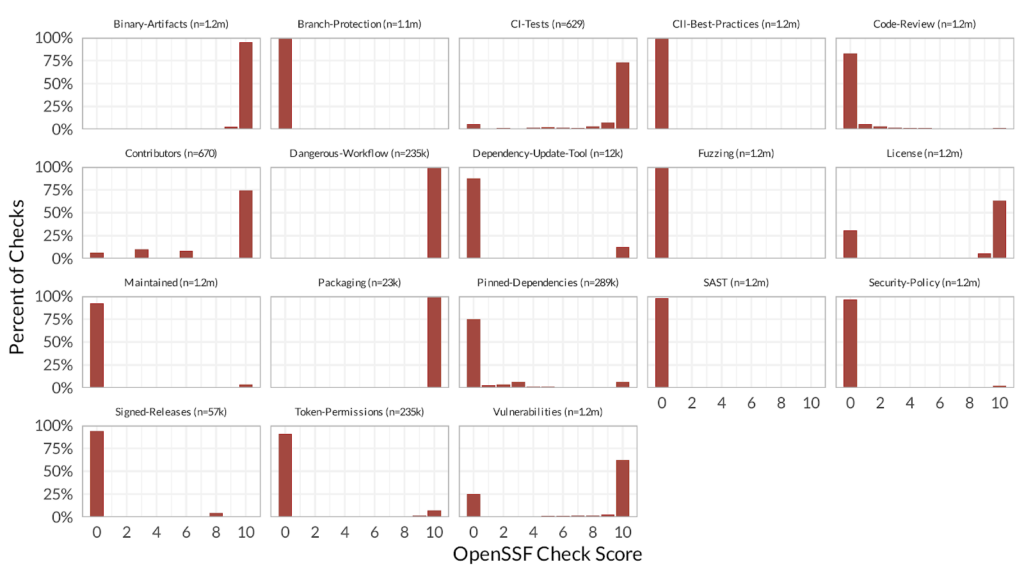
First notice the counts (i.e. the n values). Recall that about 1.2 million projects are scored and published on a weekly basis. However, not all projects receive a score for all of the checks (or to be precise, some projects receive a score of -1 for some checks).
For example, while most of the checks have n=1.2m, notice that Packaging has n=23k. The main reason for this is that the tool only recognizes a few specific indicators of a packaging workflow. They want to award credit when they see known good behavior, but they don’t want to give a 0 just because their tool is limited (e.g. maybe the package is published to PyPi or npm but it’s done outside of the GitHub workflow).
But then, for other checks, like SAST, the tool awards credit if the repo is configured to use one of the three SAST tools they recognize, but you get a 0 even if you’re using a SAST tool that they don’t know how to detect. This is inconsistent with the scoring philosophy of the Packaging check.
Second, look how skewed most of the measurements are toward one end or the other. This can be because it’s a yes/no answer, or because there’s not really a 0-to-10 granularity in the metric, so it’s only possible to achieve certain scores. Also, though some of the charts appear to have no bars for mid-range scores, it’s just that the bars are very small compared to 10s and 0s.
In the full presentation, we talk through a few of the specific checks to illustrate limitations or oddities of the scoring rubric, plus – in a few cases – pretty simple techniques to “game” some of the checks, if you were inclined to do so.
But the thing to take away here is that as you’re looking at any given project’s OpenSSF score, it’s important to remember that the score is limited by the tooling. To be fair, the securityscorecards.dev page for each project does display a “?” when there is no score present for a particular check, but that doesn’t account for cases where some of the 0 scores may be misleading.
What really contributes to open-source vulnerabilities?
As a final step, we took every variable we had – OpenSSF factors, the Veracode data set, and the GitHub metadata – and threw them into a model using a technique called elastic net. This is a way to filter down all of these variables to determine which ones are strong contributors. If you imagine a knob that controls resistance, and if the variable has enough of a signal to break through that resistance, it’s going to show up as a contributor. Out of a few dozen variables, the ones below had the strongest correlations to vulnerabilities.
Remember of course that this is correlation, not causation. Red and to the right means “correlated with more vulnerabilities” while blue and to the left means “correlated with less vulnerabilities.”
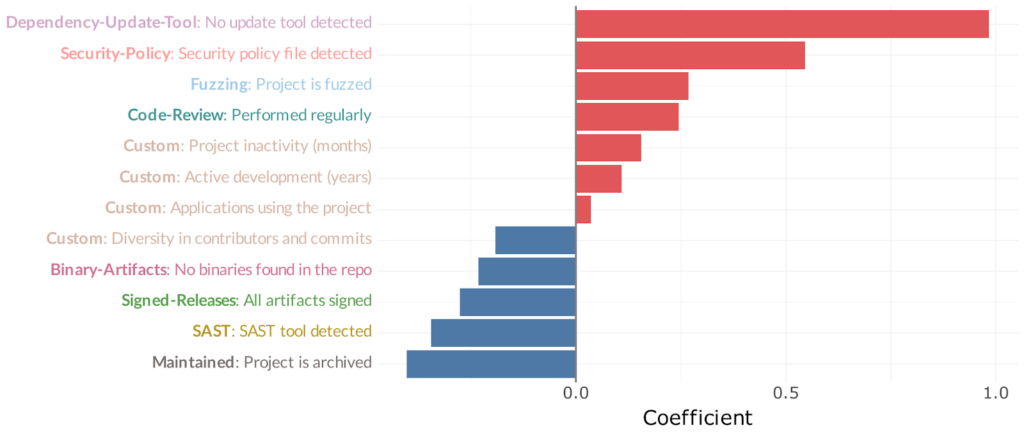
The strongest correlation to vulnerabilities was not having a dependency update tool configured – one of the OpenSSF checks. In other words, the projects that let their downstream dependencies fall behind were more likely to have unfixed vulnerabilities.
The next three bars initially seem surprising but make sense once you think about it. For example, security policy, usually in the form of a SECURITY.md file, gives instructions on how to report a vulnerability. So it’s not unreasonable that a project does this is going to have more known vulnerabilities. The same logic applies to fuzzing and code review. All of these are also practices typically associated with mature open-source projects.
It is promising that some of the characteristics that intuitively you’d expect to correlate with fewer vulnerabilities actually do! According to the blue bars, these are some positive attributes to look for:
- Projects with evenly-distributed contributor activity (i.e. not dominated by one or two developers)
- Projects without binary artifacts in the repo (which are potentially suspicious but not necessarily)
- Projects using artifact signing to ensure package integrity
- Projects using static analysis to detect flaws (hopefully before they get merged in)
Final thoughts
Like most “simple” questions, this one turned out to be pretty nuanced and with no straightforward conclusion. But we did have some takeaways.
First, any data is only as good as the collection method. We saw incomplete OpenSSF data as well as inconsistencies in scoring philosophy, which introduced unintentional signals.
We also saw a lot of noise in the model. In other words, many of the several dozen factors we looked at did were not helpful. They just didn’t correlate to vulnerabilities in any meaningful way.
Finally, using OSV as the source of truth for known vulnerabilities is a narrower viewpoint than we could have taken. No vulnerability database is complete, and they tend not to track other sources of risk such as malicious code introduction.
That being said, the OpenSSF scorecard is a promising project. Despite the data collection issues we’ve already described, it provides a wealth of data on a frequently reoccurring basis, and this is a valuable starting point.
Interested in digging in more? Get started by looking up the OpenSSF scores for some of the open-source libraries you use in your own applications. Be wary of putting too much emphasis on the overall score; instead, pay attention to what’s reported for the individual checks. From here, think about ways to assess the other risk categories associated with third-party software (remember – we focused primarily on known vulnerabilities) and incorporate your own measurements!
Footnote on data collection
OpenSSF publishes a BigQuery public dataset of their weekly scorecard results. We strongly suggest that you do not use this. We learned the hard way that many, many data points are missing from BigQuery. For example, in the BigQuery dataset, we only saw 62k repos with a Binary-Artifacts score and 212 repos with a Maintained score. In contrast, when fetching each repository’s scorecard via the Scorecard API, we observed 1.2M repos with defined scores for these factors. We saw similar across many of the scorecard checks. The BigQuery dataset just does not seem like a reliable source of information, at least not as of May 2024. We don’t know why, but consider yourself warned!